A method for filtering out unnecessary data before you run your report is to use the Pre-Filters stage. This stage allows for the selection of specific processes, request statuses, submission statuses, and form types on which to report. If you choose to not select something, it will automatically be filtered out of the report when it is run the first time.
For example, many reports will initially contain requests that were marked as abandoned before a decision was made. One common use of pre-filtering is to eliminate these requests from your report by unchecking that request status from the Request Statuses section.
Add a Filter to a Report
The filter functionality allows for the elimination of rows that are not needed in a report. In addition to hiding unwanted data, filtering eliminates rows from any totals or averages in a report. Rows that have been filtered out will not be included in any charts or crosstabs created.
-
Run a Report, and then click the Filter button at the top of the report.
- Click the Filter Column drop-down menu, and then select the name of the column to be included in the filter.
- Click the Comparison drop-down menu, and then select the comparison to be made in the column.
- Enter the value to be included in the comparison in the Value textbox.
- For example, the filter below would allow for only requests where the amount awarded is less than $10,000. Requests where the amount awarded is greater than $10,000 would be filtered out of the report.
- For example, the filter below would allow for only requests where the amount awarded is less than $10,000. Requests where the amount awarded is greater than $10,000 would be filtered out of the report.
- Click Add.
- Repeat the process above to continue adding filters to the report.
Additional Information
In the example below, two filters have been added. The first filters the amount awarded to only include values less than $10,000. The second filters to requests with a decision date after 9/1/2019. The example below filters the amount awarded to display values less than $10,000 and those with a decision date after the chosen date. Click the And button to change the operator to OR.
Grouping Filters
In some situations, filters may need to be grouped with parentheses.
- This can be done by using the arrows that appear to the right of each filter when there is more than one filter in a report.
- The example below has a single filter that displays amount awarded values greater than $500. The two specific date range filters are placed between parentheses, telling the report to include requests from 1/1/2019-6/1/2019 OR 1/1/2018-6/1/2018.
- The combination of these filters reads as follows: Show requests with an amount awarded greater than $500, AND that have a decision date between 1/1/2019-6/1/2019 OR 1/1/2018-6/1/2018.
- Click the minus (-) icon to remove a set of parentheses or the plus (+) icon to add a set.

Filter with Numeric Data
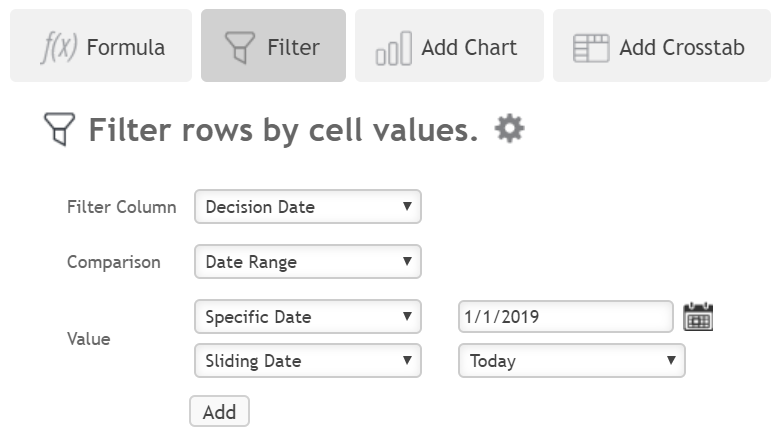
When filtering on numeric data or dates, the report can be filtered by a specific value or by a range.
- In the example below, the filter includes requests with a decision date between January 1, 2019, and a sliding date of Today.
- The report can also be filtered on other sliding dates. A sliding date filter allows for the report to be filtered on requests for a date range that would be updated every time the report is run. For example, the report could be filtered to only see the grants made last month or only see payments due next quarter and the report will be updated each time the report is run.
This video provides an overview of adding a filter to a report.